
Cesium 134 transport to American west coast
http://pubs.acs.org/doi/abs/10.1021/es203217u
http://nadp.sws.uiuc.edu/fukushima/

Atmospheric back trajectories from sites where radioactive fallout was measured in NADP wet deposition samples. NOAA’s HYSPLIT model was used for this analysis
Measurement of Radioactive Fallout from the March 2011 Fukushima Nuclear Reactor Incident Source: U.S. Geological Survey (USGS) in collaboration with the National Atmospheric Deposition Program
The study found concentrations (activity) and fallout (deposition) of radioactive iodine and radioactive cesium in significant number of samples. Detectable quantities of Iodine-131, Cesium-137, and Cesium-134 were observed at 21% of the 167 tested locations. Concentrations of I-131 detected in 5 samples ranged from 29.6 to 1090 picocuries per liter (pCi/L). Concentrations of Cs-134 detected in 23 samples ranged from 0.4 to 55 pCi/L. Concentrations of Cs-137 in 33 samples ranged from 0.70 pCi/L to 39 pCi/L.
Posted at http://enenews.com/map-fukushima-fallout-transported-directly-canada-mexico-avoided-contamination-video
Report on Iodine 131, Cesium 134 and Cesium 137 fallout in the United States from Fukushima up to April 5, 2011 from the United States Geological Survey with maps of fall-out variations:
[Note: locations of USGS sites where samples were collected are given by state, but only in latitude and longitude. An atlas can provide more specific information on the locations.]
Fission Products in National Atmospheric Deposition Program—Wet Deposition Samples Prior to and Following the Fukushima Dai-Ichi Nuclear Power Plant Incident, March 8–April 5, 2011 — Open-File Report 2011-1277
By Gregory A. Wetherbee, Timothy M. Debey, Mark A. Nilles, Christopher M.B. Lehmann, and David A. Gay
Link: USGS, Fission Products, National Deposition 3-8 – 4-5-11
Example:

NADP sites where USGS measured 137Cs in precipitation samples. Dot size represents relative deposition amounts (0.8 – 240 Bq/m²).
http://nadp.sws.uiuc.edu/fukushima/ — map can be enlarged.
[National Atmospheric Deposition Program – NADP]
————————————————————————————————-
Lujanien_ e, G., et al., Radionuclides from the Fukushima accident in the air over Lithuania: measurement and modelling approaches, Journal of Environmental Radioactivity (2012), doi:10.1016/j.jenvrad.2011.12.004:
[Note: Cs is Cesium, and this analyzes only one release on one day from Fukushima Daichi- not the multiple or ongoing releases]
“A single release of 1015 Bq of 137Cs, which occurred on March 12, 2011 from damaged Fukushima NPP was analyzed. The initial plume height, as a result of initial vertical velocity and buoyancy, was kept to be at 2000e3000 m. The meteorological data and simulated trajectories revealed that the arrival times of particles released on 11 March, 2011 and 12 March, 2011 were different, and the particles were transported at different altitudes. It was also obvious that the jet stream affected the transport of emitted particles at upper atmospheric levels. Examples of the trajectories simulated using the Lagrangian dispersion model show (Fig. 1) that the first signs of Fukushima released radionuclides could be detected in the European countries (e.g. Island) on 20 March, 2011.”
The maps below can be seen clearly at the ENE News link below, especially if you save it and open it on your computer. The white field at the top is Greenland. The top map has a very dark area. This is directly over North America, especially the United States.
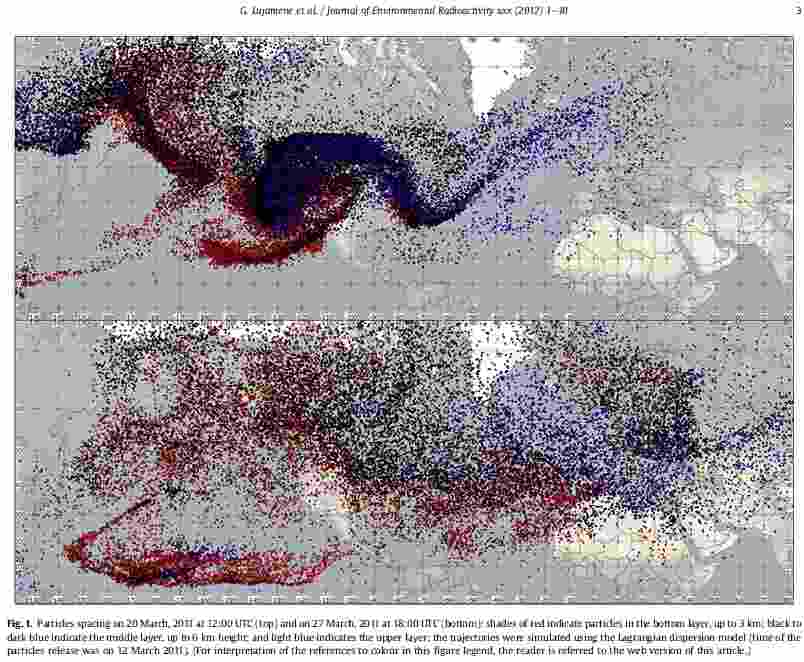
Fig. 1. Particles spacing on 20 March, 2011 at 12:00 UTC (top) and on 27 March, 2011 at 18:00 UTC (bottom); shades of red indicate particles in the bottom layer, up to 3 km; black to dark blue indicate the middle layer, up to 6 km height; and light blue indicates the upper layer; the trajectories were simulated using the Lagrangian dispersion model (time of the particles release was on 12 March 2011). (For interpretation of the references to colour in this figure legend, the reader is referred to the web version of this article. [– only for members or if you purchase the article])
SOURCE: Lujanien_ e, G., et al.
Posted at http://enenews.com/study-all-western-east-coast-covered-airborne-particles-march-20-model-shows-canada-based-solely-reactor-1-explosion-photo
————————————————————————————————–
Gov’t Paper: Air samples so hot from Fukushima, special handling required — U.S. had more stations at Level 5 than rest of world combined — Oklahoma lab reached overload (MAP), posted 3-8-14
Melbourne, Florida had highest iodine-131 reading of any CTBTO monitoring station in the world from March 22-23 (CHART), posted 4-17-11

http://db.eurad.uni-koeln.de/prognose/data/alert/ra_animation.gif for larger map
————————————————————————————————–
From ENE News —
Newspaper ignores scientific models that show Fukushima radiation impacting West Coast — Fails to inform readers by only reporting on discredited tsunami wave-height map — “What illness of the mind must people have to lie about the threat?” (ACTUAL FORECAST MODELS)
Published: January 24th, 2014
Excerpt:
In reality, the Fukushima radiation forecast models published by scientific journals, governments, and universities show a more troubling situation for the West Coast than the discredited tsunami wave-height map. The tsunami map shows the impact being distributed throughout the entire pacific, with South America getting the worst of it. The actual Fukushima radiation transport models show the contamination heading due east, directly to North America’s west coast. Here are a some examples (note that none of these models take into account the ongoing releases from Fukushima of hundreds of tons of contaminated water every day) [400 tons per day]
